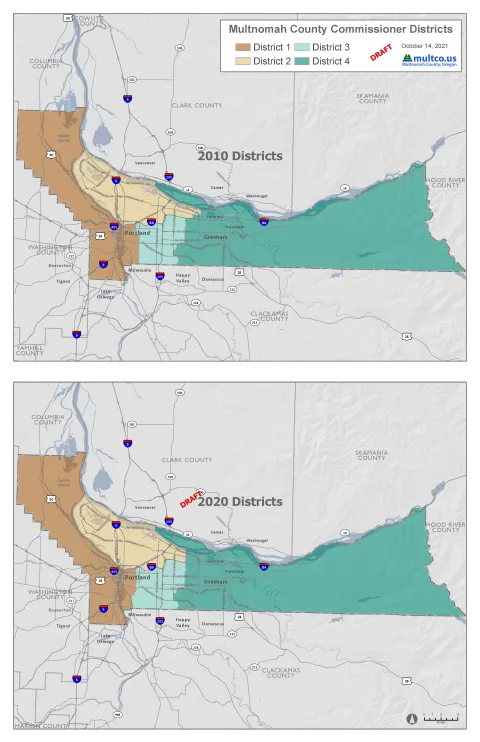
The Auditor's Office invites you to visit an interactive map showing our proposed new Multnomah County Commissioner district boundaries.
You can also read a description of the current boundaries and proposed changes, or view static maps showing the current and proposed boundaries.
The Auditor’s Office is charged by the County Charter with redrawing commissioner districts when the U.S. Census shows that any individual district has become 103% larger than any other district. This has occurred with the 2020 Census. (See the Auditor’s Office Redistricting Information page for more information on the Charter’s requirements and the Auditor’s role.)
Please note that these are proposed – or draft – Commissioner district boundaries. As we collect feedback from community members, we may change this proposal.
The Auditor will present the proposed district changes to the Board of County Commissioners (BOCC) on 12/14/21. The Board will vote on whether or not to approve the proposed changes on 12/16/21. Learn more about how to attend Board meetings virtually or in-person.
How to use the interactive map
The interactive map has several features to help people better understand the Auditor’s redistricting proposal. The layers described below can be selected on their own or in combination with others to provide more detail.
- The first two layers that you can activate by clicking on the checkbox show the 2010 commissioner district boundaries (in red) and the proposed 2020 district boundaries (in blue). You can display one or the other or both sets of lines. The County Charter requires us to maintain the general geographic characteristics of the existing districts in drawing the new ones.
- The Census Blocks 2020 layer displays the smallest grouping of people within the census. By selecting this layer, you can click on any census block on the map to see how many people live in that block as well as the racial/ethnic makeup of those people. We drew the commissioner boundaries without dividing any of these census blocks in order to have a more accurate count of people within each district. Not all census blocks have the same number of people.
- The next eight layers allow you to display population density for people according to the race/ethnicity they selected in the census. Clicking the triangle to the left of the check box shows the color key. Note that population density does not equal large population. To get a sense for a census block’s population density and overall population, it can be helpful to look at the race/ethnicity layers and the census block itself.
- The next three layers allow you to display proposed U.S. House and Oregon legislative districts. These impacted our proposed commissioner districts in that the Oregon Secretary of State has directed us to “utilize existing geographic or political boundaries” where practical.
- The last layer – jurisdiction group – allows you to display other jurisdictional boundaries to compare them to our proposed commissioner district boundaries. Clicking on the check box and then clicking on the triangle next to the check box allows you to select these other jurisdictional boundaries. For example, you can compare our proposed commissioner district boundaries to school district or neighborhood association boundaries.
Read a description of the proposed boundary changes
Compare the current district boundaries with the 2021 proposed changes

