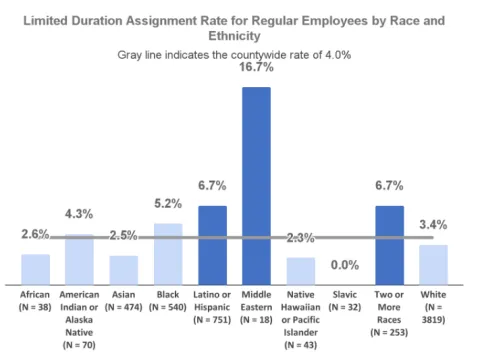
A bar graph with race and ethnicity on the x-axis and limited duration assignment rate for regular employees on the y-axis. African (N=38) with a rate of 2.6%, American Indian or Alaska Native (N=70) with a rate of 4.3%, Asian (N=474) with a rate of 2.5%), Black (N=751) with a rate of 5.2%, Latino or Hispanic (N=751) with a rate of 6.7%, Middle Eastern (N=18) with a rate of 16.7%, Native Hawaiian or Pacific Islander (N=43) with a rate of 2.3%, Slavic (N=32) with a rate of 0%, Two or More Races (N=253) with a rate of 6.7%, and White (N=3819) with a rate of (3.4%). The countywide rate is (4%).