Multnomah County, Washington County and Clackamas County today announced the results of a groundbreaking heat mapping project that measures the unequal distribution of heat in our communities that can lead to harmful and inequitable impacts across the Portland metro area.
On July 22, 2023 125 volunteers partnered with the counties to map differences in temperature throughout the region. By using special equipment attached to their cars, volunteers collected more than 269,000 temperature readings in neighborhoods across the three counties. The same method has been used globally and was deployed in a cohort of communities organized by NOAA in summer 2023. The Portland metro project is the largest in the world to date, covering over 400 square miles.
“As climate change continues to affect our local communities in new ways, we must continually review our response and look at data at the neighborhood level to make sure our vulnerable communities are protected,” said Brendon Haggerty, Multnomah County’s Healthy Homes and Communities program manager. “This study is a powerful tool for protecting public health — it’s a great example of how public health measures risks so that we can all work together to reduce climate impacts.”
“Collecting the data was a collaborative process, one that continues as we learn how to best use this data together,” said Kathleen Johnson, Washington County’s community environmental health senior program coordinator. “The information will be instrumental in informing our work with communities, community-based organizations, health systems, and governmental agencies to help those living in the hottest areas in our region.”
“I want people who find their homes and workplaces in hotter areas to feel empowered to use this information to prepare and adapt,” said Dr. Sarah Present, Clackamas County’s Health Officer. “People can better understand their personal risks and make a plan for hot summer days. People can also take small steps with their neighborhoods, employers, and local government to cool these areas down over time. Fortunately, we still have time to make changes in our communities today to help us adapt to a warmer future.”
The study’s results have been turned into a free, accessible map, along with a report and
Measuring heat for a more resilient future
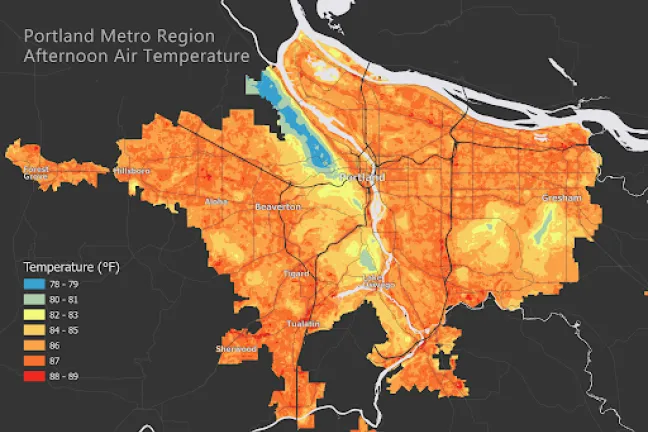
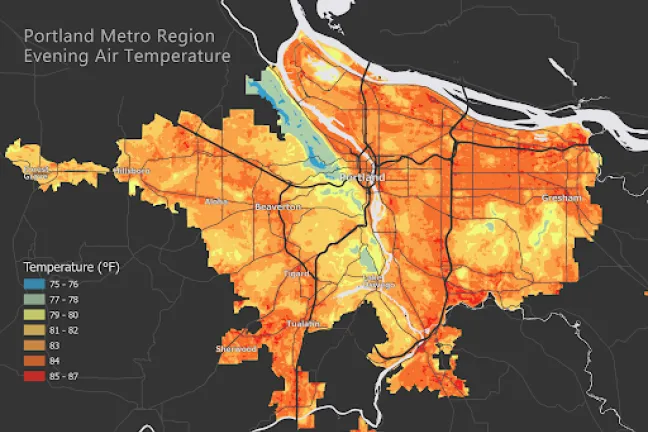
The data makes it clear that heat is not experienced equally across our region. While the National Weather Service recorded a high of 89 degrees Fahrenheit (F) at the Portland International Airport on July 22, 2023, the highest temperatures recorded by a volunteer were almost six degrees warmer in the Tualatin area. The highest recorded temperature in the morning was 65.3 F, in the afternoon was 94.6 F and in the evening was 92.1 F.
The lowest recorded temperature in the morning was 50.5 F, in the afternoon was 77.4 F and in the evening was 74.4 F. These temperatures were recorded near Forest Park, near Lake Oswego and near the Lewis & Clark College campus. There was a 17.2 degree Fahrenheit difference between the hottest and coolest places across the Portland metro region, which occurred during the afternoon data collection and is the difference between the hottest recorded temperature and coolest during that time period.
- Multnomah County’s hottest cities included Wood Village, Maywood Park and Fairview. The hottest areas are near Lents, Mall 205 and industrial areas near Portland International Airport.
- Washington County’s hottest areas include parts of Sherwood, Tualatin and Cornelius.
- Clackamas County’s hottest cities included Molalla, Canby and Wilsonville.
The hottest areas were mostly suburban cities near highways. These areas have similar attributes including fewer trees, more hard surfaces like roads, rooftops and parking lots, and sprawling development patterns. The coolest areas were parks and rural forested areas.
It’s important to understand heat in our community because climate change is making it more likely that our region will experience dangerous, extreme heat events like the 2021 heat dome. As temperatures become hotter in the tri-county region, emergency medical services calls, hospitalizations and mortality will also continue to increase.
Heat-related health risks in the Metro area are exacerbated by existing inequities in housing, access to healthcare and health outcomes. Some groups are more at risk for serious health effects from heat, including:
- Children
- Older adults
- Pregnant people
- Outdoor workers
- Low-income households
- Athletes who exercise outdoors
- People living unsheltered or homeless
- People who are socially isolated
- People with certain medical conditions or who are taking certain medications
Health effects from heat include:
- Heat stroke
- Breathing problems
- Heart trouble
- Pregnancy complications
Applying data to reduce harmful effects of hotter summers
The study’s results will inform both immediate and long-term actions by the three counties including work related to emergency management, public health, homelessness, human services, land use, urban planning and infrastructure design. For example:
- Multnomah County will update their Heat Vulnerability Index (HVI) with the new data.
- Clackamas County will use this information to inform their Climate Adaptation plan, Natural Hazard Mitigation plan and other emergency response plans to reduce impacts of extreme heat on employees, community members and visitors.
- Washington County will use this information to inform their Climate Adaptation plan and emergency response plans for extreme heat.
- All three counties are working together, along with healthcare systems, to help areas with high heat become safer over time.
- The data will inform city and county-level decisions about land use planning, transportation, housing and tree planting.
- Healthcare and outreach workers will use this information to prioritize people who are most at risk during extreme heat.
The counties conducted the study with CAPA Strategies, a climate consulting firm that works with municipal governments, nonprofits, universities and businesses to describe hyper-local hazards, such as extreme heat, and develop solutions to build resilience and adaptive capacity with and for communities.
Make a plan to protect yourself and your community from extreme heat
Stay informed: Sign up for public alerts.
Take heat safety seriously: When it’s hot, take care of yourself by drinking water, avoiding strenuous outdoor activities during peak heat hours and knowing the signs of heat illness. Learn more from the CDC’s Tips for Preventing Heat-Related Illness.
Support your neighbors: Neighbors helping neighbors is the best way to keep us all safe. Check on your neighbors during a heatwave to make sure they stay safe and cool. In particular, think about those who are:
- Living alone
- Without air conditioning
- Living with a chronic illness
- A part of another vulnerable group
Create cool spaces: Take steps to create cool spaces within your home.
- Use fans (when below 95 degrees Fahrenheit)
- Close curtains or blinds during the hottest part of the day
- Improve airflow by opening windows during cooler parts of the day
Prepare: Prepare an emergency kit for heat-related emergencies.
- Water
- Non-perishable food
- Medications
- First aid supplies
Make a plan to keep your home cool or find an air conditioned space. Households who need low-cost air conditioning should call 211 to find more resources.